(5) Debugging
Due: Tuesday, January 20, 11:59 PM Eastern
Don’t get stressed about bugs (mistakes) in your code. It’s ok! It happens to everyone who programs, no matter how much experience they have. Finding and fixing bugs is a skill you can learn. The idea is to gradually narrow down where the bug in your code is, so that you know what to fix.
In this tutorial, we’ll learn how to use a special debugger tool. Then we’ll consider some debugging tips. If you invest a little time pondering this information, you will save a lot of time in the long run!
What Is a Debugger?
You may recall that a bug in a program is a problem or mistake. Most commonly, the word doesn’t refer to syntax errors, but rather to semantic errors. The program runs, but then crashes or produces other wrong behavior.
A debugger is a program meant to help the programmer fix bugs. It takes just a few minutes to learn how to use a debugger. Invest this time now – you’ll be glad you did!
We’ll be using the debugger that is a part of VS Code.
Using a Debugger
Inserting a Breakpoint
Open your EECS_183 folder, the practice_code subfolder. (Or make one if you don’t already have it.) Open VS Code in that folder. Make a new .py file (I called mine debug_test.py) and paste the following into it:
x = 5
y = x + 2
x = x + 1
print(x)
print(y)
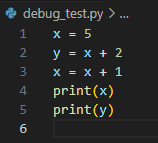
Your code should then look like this:
Let’s add a breakpoint to this program. A breakpoint is not part of the code itself; rather, it’s a signal to the debugger that we want the code execution to stop at that line, so that we can inspect what’s happening. We’ll see how this works further below.
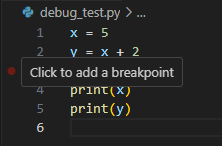
Notice that line numbers are indicated (1 - 6 here). Hover your mouse pointer just to the left of line 3 and you’ll see this:
Click at that point, and you should see a brighter red circle that stays there even when you move your mouse away:
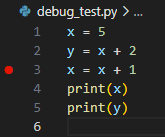
We have now inserted a breakpoint at line 3 of the code!
Starting the Debugger
The easiest way to start the debugger is via the Run menu at the top. (The menu order is likely File, Edit, Selection, View, Go, Run, Terminal, Help.) Click to open the Run menu and choose Start Debugging. This will start the debugger.
If you just hit the main run / play button instead, it’ll run the program as usual and ignore any breakpoints. This corresponds to the Run menu option Run Without Debugging.
Stepping Through Code With the Debugger
You should now see this:
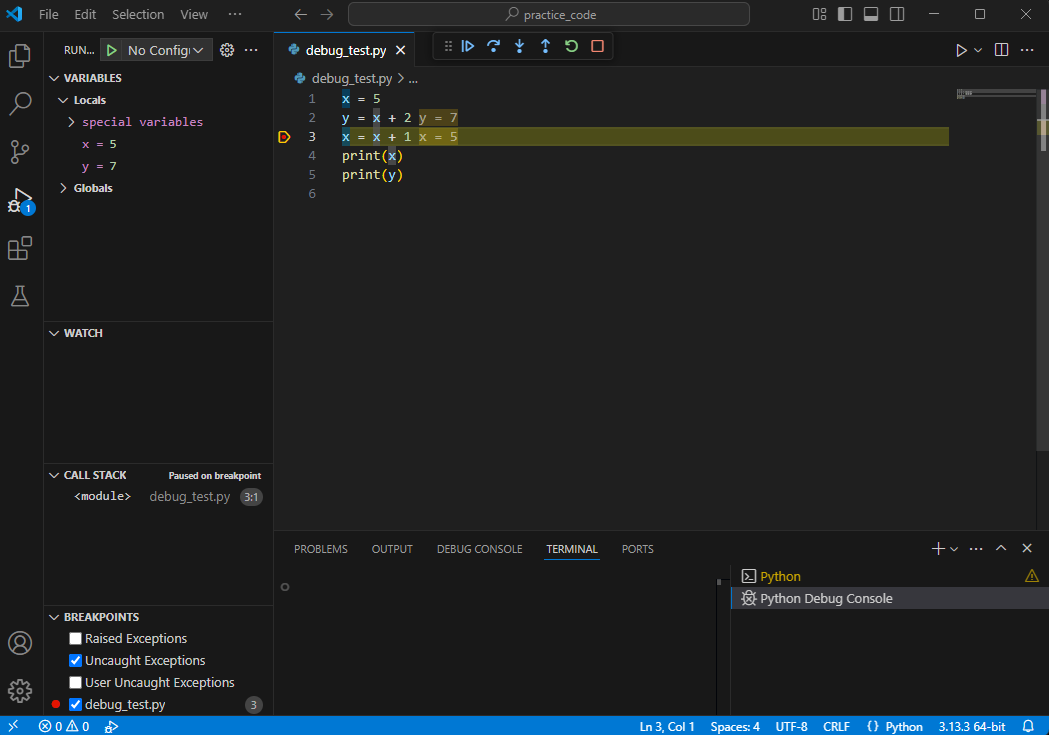
In the upper-left, under Variables, you can see a listing of the values of the variables we’re working with. You can also click any > symbol to expand that part, though in this simple program there’s not much else to see.
There are many features of a debugger. Let’s examine a few. In the top middle, are these buttons:
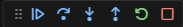
You can hover your mouse pointer over each button to get a hint about what it is. The leftmost button, Continue, will just let the code run again. It will keep running until it hits a breakpoint again or the program terminates. In this case, the program will just terminate.
The Step Over button (right arrow) is basically just “go to the next line” and for the moment behaves similarly to the Step Into button (down arrow). More details later. For now, click the Step Into button and you’ll notice that the debugger indicates you’re on line 4 now. Also note in the upper-left area that the value of x is now shown to be 6.
The Restart button (circle arrow) starts the program over again. The Stop button (red square) stops the debugger.
Note: If you hit Stop but the debugger seems to still be going, just hit Stop again. Sometimes it’s possible to have multiple debugger instances running at once.
Stepping Through Code That Includes Our Own Functions
If you’re reading this at a time when we haven’t yet discussed writing functions, then you may not fully understand the code we’re about to look at. That’s fine! Try this out now and know that we’ll cover everything in class soon; then you can try this out again.
First, remove the breakpoint you’ve placed by clicking the red dot to the left of line 3. Then copy the following code into your file (overwriting what was there before):
def my_function():
    z = 5
    z = z + 1
    print(z)

def main():
    x = 5
    y = x + 2
    x = x + 1
    my_function()
    print(x)
    print(y)

if __name__ == '__main__':
    main()
Put a breakpoint at line 9 (x = x + 1) and run the debugger. When the debugger stops at that line, click Step Into and observe the result. Keep clicking Step Into, observing the result after each click. You’ll notice that when in my_function, the x and y variables are no longer shown under Locals in the Variables window, but after executing line 2 (z = 5), the variable z is shown. Keep clicking Step Into and observe that the program continues back in main once my_function completes.
Now do the same again except click Step Over repeatedly instead of Step Into. You’ll notice that the debugger seems to have skipped the execution of my_function. Actually, my_function did execute, it just did it behind the scenes and didn’t show you the details. Thus:
Step Intoshows you the execution inside of every function you call (that you’ve written).Step Overstill executes each function call, but doesn’t step through it line by line with you.
Use both as needed each time you’re debugging.
Similarly, if you’re stepping inside of a function (e.g., my_function) and decide you want to jump out of it and resume debugging in the calling function, you can hit the Step Out button (up arrow). Experiment with that by hitting Step Into until you’re inside of my_function, and then hit Step Out once.
Debugging Tips
So now you know how to use the main features of a debugger. Nice work! Now, effective debugging takes practice. You’ll get better and better at it. Here are some tips:
Use your computer, not just the autograder
- Early in a project timeline, don’t be shy about submitting to the autograder. It’s helpful to get some early feedback.
- Keep in mind your daily limit of submissions, though. Closer to the deadline, you may need to save some of your submissions for when you think your code is already perfect.
- Make sure you test your code as much as possible on your own computer. Don’t rely solely on the autograder for testing!
Error messages are usually helpful
- Sometimes, your Python programs will crash. It happens to everyone. The error message can often look cryptic or intimidating. Don’t be intimidated! You can do this. The error message usually tells you the line number where something went wrong, and often gives you a hint about what went wrong. Read the error message carefully and see what you can learn from it.
- Next, think of that line as the last symptom of the problem. Maybe the mistake is in that line. Or maybe that line uses a variable, say,
z, that is set earlier, and the setting ofzis wrong. Or maybe the setting ofzis correct, but one of the values thatzdepends on is wrong, and so on. So the line where the error occurs is the last symptom, and you want to work your way backwards to the cause.
Error messages are not always helpful
- Ha, yeah. Sometimes the Python interpreter gets confused. It does its best to say what the mistake is, but sometimes it’s wrong. It may raise an error on a line that is totally fine, when actually the mistake is that a few lines up you indented incorrectly, or forgot a
:, or forgot a closing),], or}. So if you see an error message that doesn’t make sense, check the lines above it for mistakes like this.
Handling wrong output
- Other times, your code will run without any errors, but the output is wrong.
- Maybe you recognize this when running on your own computer. Maybe you only recognize it when you submit it and see that the autograder, by checking the “Output Diffs” section.
- When the autograder says there’s a problem, one helpful strategy is to deduce what inputs the autograder is testing with and to make that test case on your own computer. Then you can debug it locally without using up your submission attempts. Add the corresponding test case to testing code you may already have.
- Whether you have errors or bad output, the tips below can help.
Explain what’s happening
- When your code isn’t working, take a moment to say, out loud, what the code is supposed to do, what it’s actually doing, and where you think the problem might be. This can help you organize your thoughts and may lead to insights about the problem. It’s important that you actually say this out loud, since thoughts in our heads tend to be less precise at times like this. Real-world software engineers often speak to a toy rubber duck, stuffed animal, etc., explaining their code to it. This is called “rubber duck debugging”. Try it! Or if you’re working with a partner, try explaining it to your partner; even though you may feel silly doing this because they’re experiencing the same thing you are, talking through the problem explicitly can often dig up new insights.
Stare at it for a minute or two; no longer
- When my program isn’t working, I start by just looking at the code for a minute or two. If clear inspiration strikes, great! I’ll make that change and try the program again. Otherwise, start doing something active, like running the debugger, adding
printstatements to check certain values, trying an example by hand and checking intermediate values with your program’s behavior, etc.
Don’t guess and check
- If clear inspiration doesn’t strike, I might be tempted to make a change anyway. “Surely I’m close! Maybe if I just change this 1 to a 0… or maybe if I just change this argument… or…” So I might be tempted to make a little change like this, not sure of why I should make that change, but hoping it’ll work because darn it, I’m busy and I really want to get this done.
- That approach to debugging is called “guess and check”. It’s BAD. Resist the temptation to guess and check. It’s meant to save time, but it usually ends up wasting lots of time, as you change things you shouldn’t change (that may already be correct) and make your code worse. Sometimes you even forget you changed them, and then have to debug that change much later.
Only make principled changes
- Only make a change to your code if you have a principled reason to make that change. That is, you believe you’ve identified what’s wrong, and how that change will make it right.
Don’t do something weird to counteract something weird
- This is related to the previous tip. Suppose your code is mostly correct, but something weird is happening. Like, maybe your numerical result is twice what it should be in certain cases… some weird head-scratching issue like that.
- You may be tempted to say “Huh, I shouldn’t have to divide by 2 here, but if I do that, it works, so I’ll do it.” Well, that would violate the Only Principled Changes rule. That “I shouldn’t have to do this” step may not actually make everything work after all; there may be a bigger problem in your code, and it’s important to investigate it and understand it fully before trying to fix it.
Use the debugger and print and if statements
- In addition to the debugger,
printstatements can be useful. For example, in a loop, you might add aprintstatement showing the current value of some variable. When a function is called, you might print out the arguments it has received. Addprintstatements like this to help you see what’s happening in your code. - When debugging, some people only use
printstatements; this is a mistake, since a debugger can be much faster and provide much more information in many cases. - But some people make the opposite mistake, of only using the debugger. I’d suggest that sometimes using the debugger is unreasonably time-consuming, like when you have code that repeats maybe hundreds of times and you just need to examine one special case. In such a situation, carefully-crafted
printstatements can give you quick information; you can ignore the pages of output you don’t care about and just look at the output right before a crash. - You could also put such
printstatements inside of anif, so that it’s only triggered at times of interest. - In short, understand both debugging approaches and apply the one that’s most useful for your particular issue.
Here are some examples of helpful print statement for debugging. You don’t have to always do all of this, but sometimes this level of detail can be very helpful.
if (some_variable == wrong_value):
    print("Debug: some_variable is the wrong value:", some_variable)
print("=========================")  # To clearly show the start of a new section of the code
print("Debug: About to process the list")
for item in some_list:
    print("----------")  # To clearly show where each iteration begins
    print("Debug: about to process item:", item)
    # process the item here
print("Debug: Done processing the list")
print("=========================")
def some_function(arg1, arg2):
    print("----------")
    print("Debug: some_function called with arg1 =", arg1, "and arg2 =", arg2)
    # rest of function here
    print("Debug: Done with some_function")
    print("----------")
def compute_something(x):
    if x == special_value:
        print("Debug: compute_something called with special_value:", x)
    # rest of function here
Fully understand the expected behavior of code before you try to write it
- The behavior of a piece of code can refer to what its inputs mean, what it should output, and what it should modify. If you don’t fully understand these components of some code you’re trying to write, then study that / ask questions before trying to write the code. This may sound obvious out of context, but it is a common mistake.
Connect programming tasks to in-class work
- Ask yourself “Why does my professor think I can do this?”. If you don’t know the answer to that question, review the course materials and look for related ideas that you’ll need. Make sure you fully understand the related course material and then go to the assigned task. If you’re not sure what course material is related, please reach out to course staff.
Removing Special Characters
- If you have special characters in your code, like smart quotes (“ ” ‘ ’) or em dashes (—), you’ll need to replace them with standard characters ( “ ‘ - ) in order for you code to run. Often, a quick way to do this is to highlight all of your code, cut it, paste it into a plain text editor (like Notepad on Windows or TextEdit on Mac in plain text mode), then copy it from there and paste it back into your code editor. Usually, characters like these pop up if you used a word processor with your code at some point. Check out Tutorial 1 sections here and here for details on how to avoid such issues in the future.
Copyright and Academic Integrity
© 2026 Steven Bogaerts.
This work is licensed under a Creative Commons Attribution-NonCommercial-ShareAlike 4.0 International License.

All materials provided for this course, including but not limited to labs, projects, notes, and starter code, are the copyrighted intellectual property of the author(s) listed in the copyright notice above. While these materials are licensed for public non-commercial use, this license does not grant you permission to post or republish your solutions to these assignments.
It is strictly prohibited to post, share, or otherwise distribute solution code (in part or in full) in any manner or on any platform, public or private, where it may be accessed by anyone other than the course staff. This includes, but is not limited to:
- Public-facing websites (like a personal blog or public GitHub repo).
- Solution-sharing websites (like Chegg or Course Hero).
- Private collections, archives, or repositories (such as student group “test banks,” club wikis, or shared Google Drives).
- Group messaging platforms (like Discord or Slack).
To do so is a violation of the university’s academic integrity policy and will be treated as such.
Asking questions by posting small code snippets to our private course discussion forum is not a violation of this policy.